

Threat intelligence for water, government and schools
The threats aimed at your sector, collected automatically, stripped of false positives and scored for your risk, so your team acts on what matters this week instead of reading everything.

The threats aimed at your sector, collected automatically, stripped of false positives and scored for your risk, so your team acts on what matters this week instead of reading everything.
Most teams drown in alerts and advisories. Ours arrive filtered and in context.
Data from internal and external sources gathered and processed automatically.
False positives identified and dismissed before anyone spends time on them.
Each alert gets real-time context and a custom risk score for your environment.
What matters goes to your SOC analyst and into a plain-language briefing for your team.
Public infrastructure is a steady target. These are the numbers behind the briefings.
Jul 2026
Water systems
Cyberattacks reported on water systems in at least seven states, alongside an FBI alert on attackers targeting internet-facing PLCs.
Jul 2023 to Dec 2024
K-12 schools
82% of K-12 schools experienced a cyber incident.
Source: K-12 Dive, on the Center for Internet Security report, Mar 2025
2024
State and local government
34% of state and local government organizations were hit by ransomware.
Source: Sophos, State of Ransomware in State and Local Government 2024
Culper-I scores each device on known exploited vulnerabilities, exploit likelihood and configuration drift, so patching starts with the machines attackers are most likely to reach.
Exposure and drift
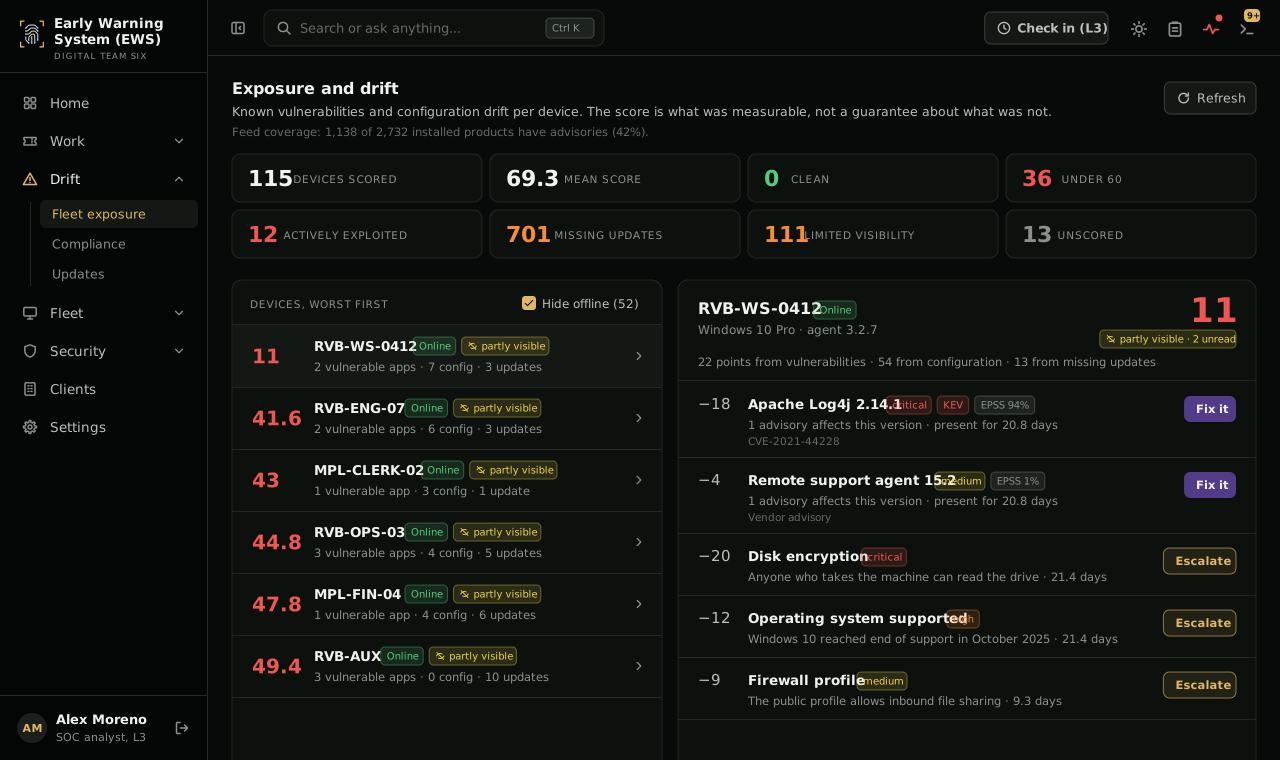
Sample data. Clients, people, devices and addresses are illustrative.
Threat intelligence is a product, not a rule, and what it produces feeds the compliance work around it.
Sector threats and advisory triage that feed the risk assessment your rules ask for.
Alerts that already carry context and a risk score, so a report starts from what is known.
Ask for a threat briefing for your sector, written for your leadership or board.
Prefer to talk now? 973-339-0090

© 2025 Digital Team Six, Inc. | Your Cyber. Our Passion.™ | Cybersecurity Solutions Specialized for Municipalities, K12, Education Sector and Non-profits.